Environmental Data
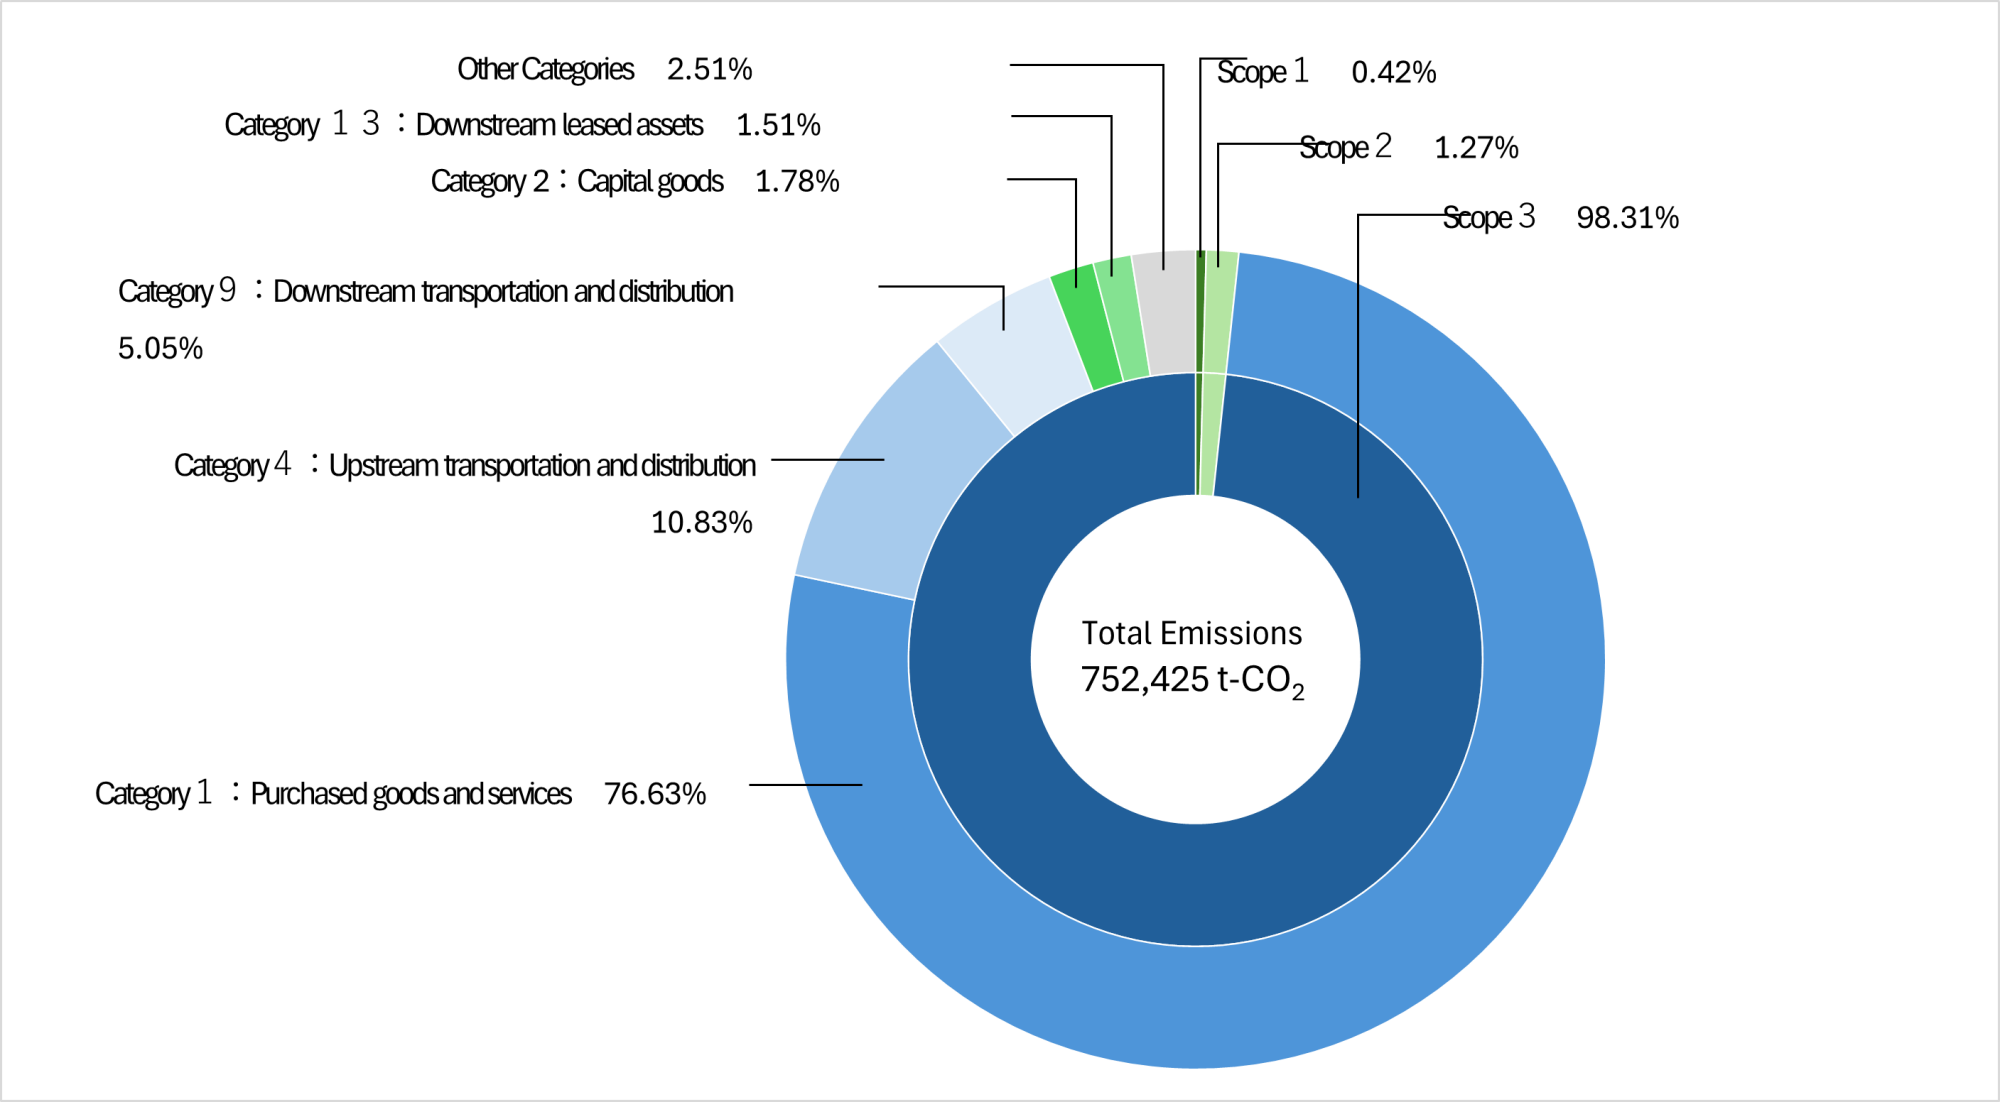
CO₂ Emissions Throughout the Entire Value Chain FY2025
Greenhouse gas emissions (Scope1 and Scope2)
Greenhouse gas emissions (Scope1 and Scope2)
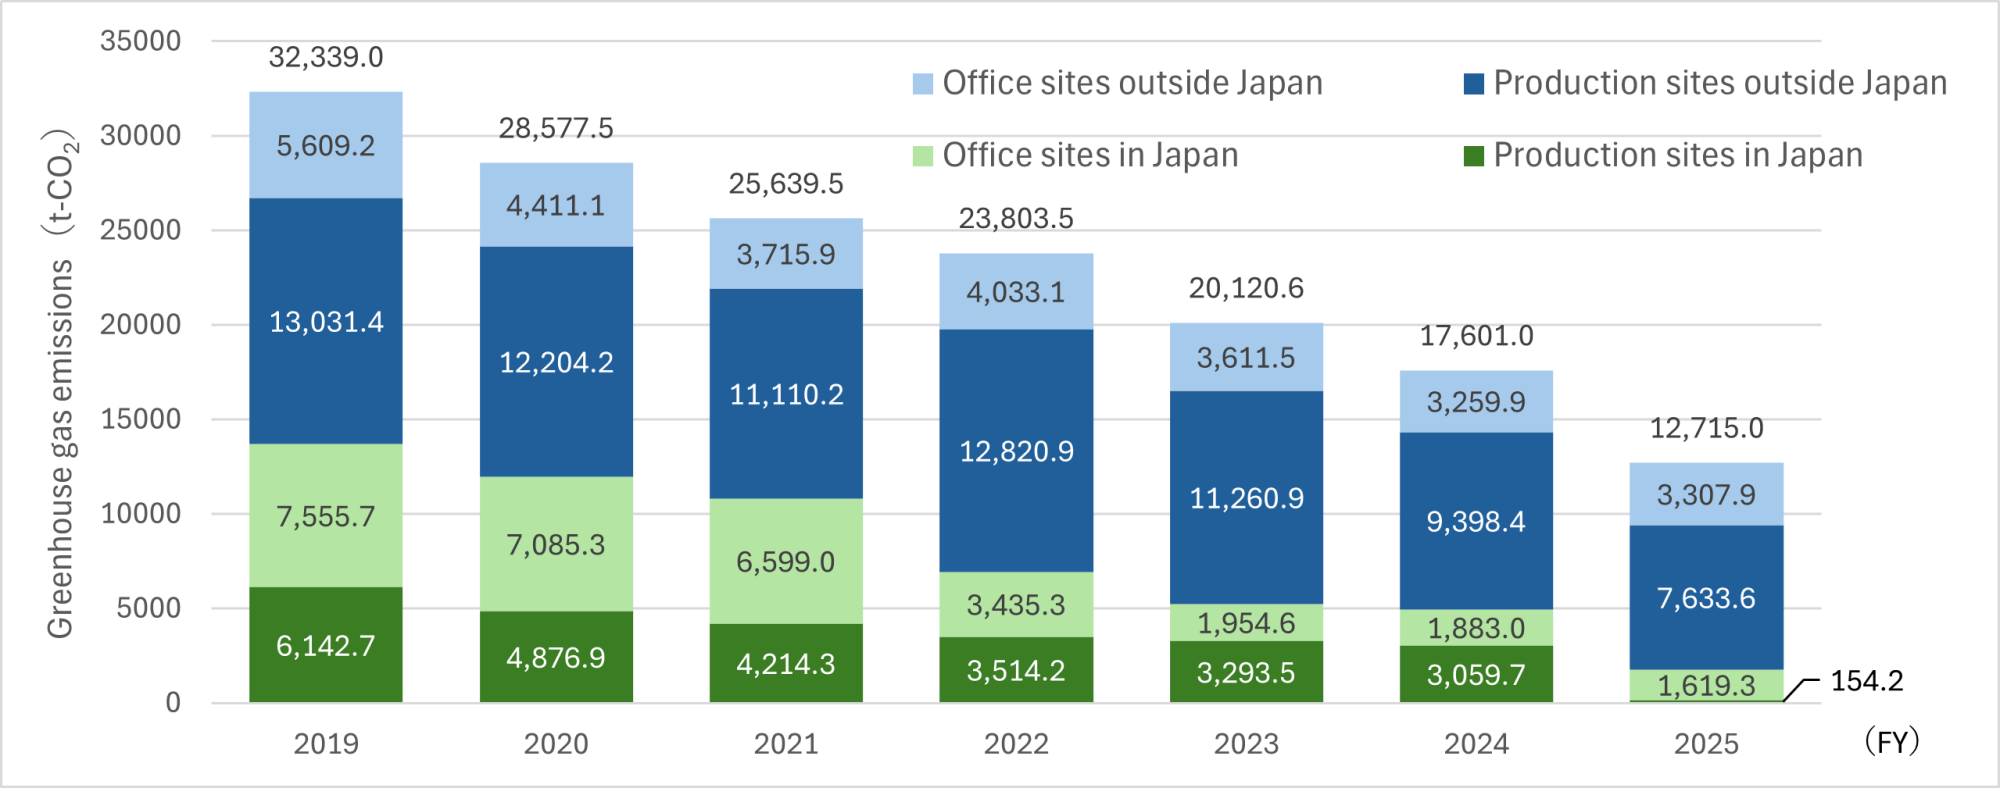
Greenhouse gas emissions (Scopes 1 and 2) calculated using the location-based standard
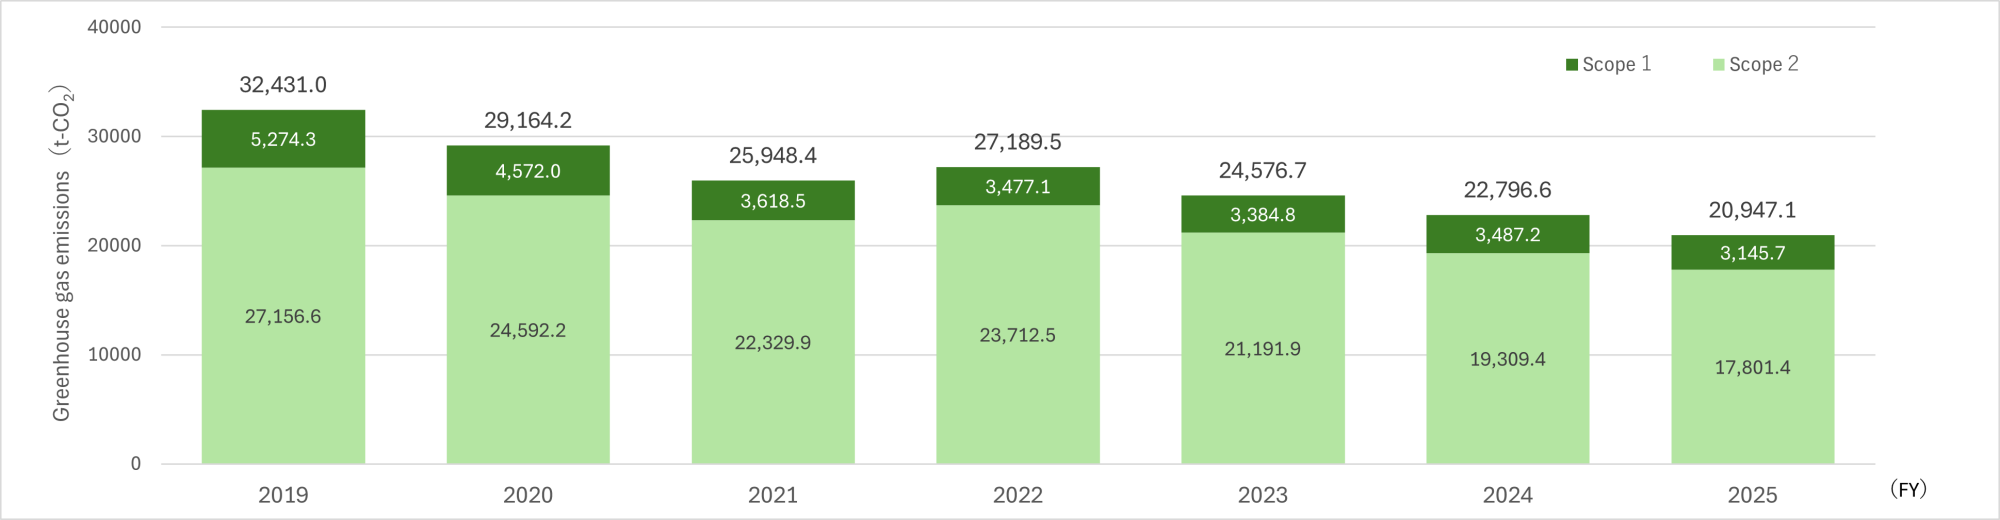
Scope 1 (3,145.7 t-CO2) and Scope 2 (17,801.4 t-CO2) for fiscal year 2025 have been subject to third-party assurance.
Due to changes in calculation methods and corrections to the figures, these values may differ from previously published figures.
(For details, please refer to the calculation standards in the Environmental performance data report.)
Greenhouse gas emissions (Scopes 1 and 2) calculated using the location-based standard: Breakdown by type of site
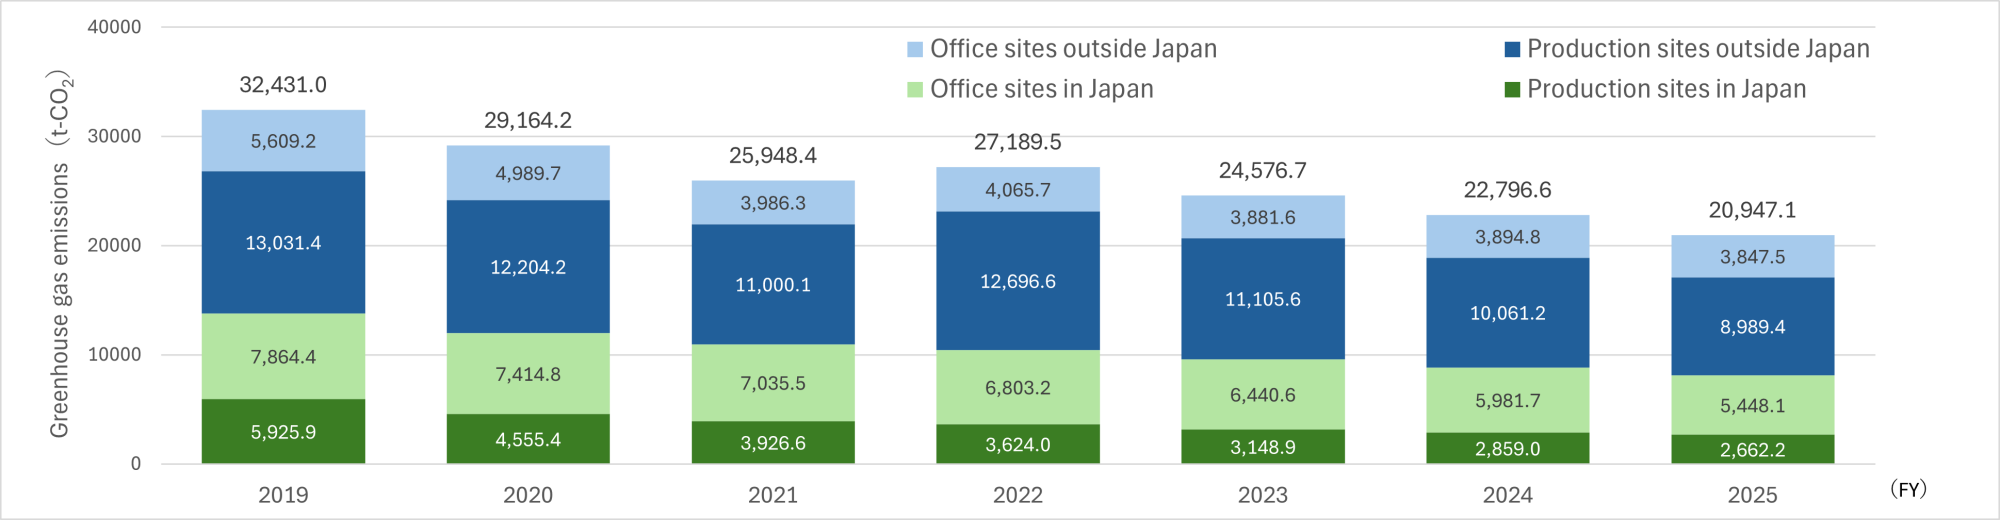
Site classifications are determined based on the organizational boundaries for each site category as set out in the "Scope of Application."
Due to revisions in calculation methods and adjustments to the figures, these values may differ from previously published figures.
(For details, please refer to the calculation standards in the Environmental performance data report.)
Greenhouse gas emissions (Scopes 1 and 2) calculated using the market-based standard
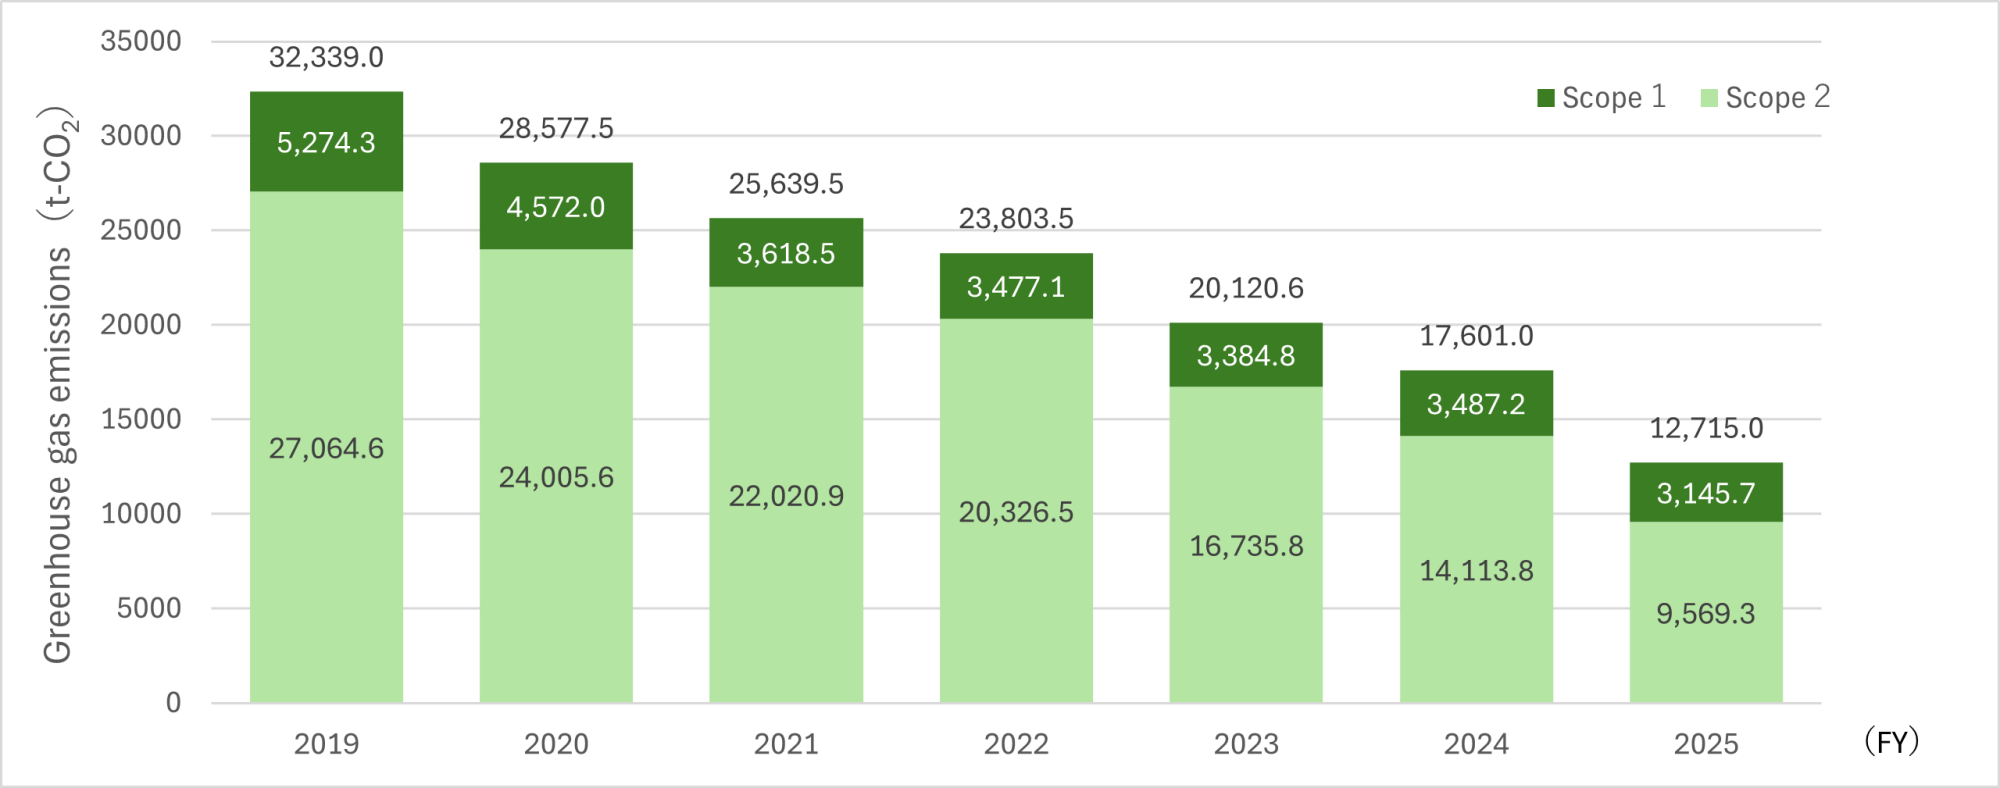
Scope 1 (3,145.7 t-CO2) and Scope 2 (9,569.3 t-CO2) for fiscal year 2025 have been subject to third-party assurance.
Due to revisions in calculation methods and adjustments to the figures, these values may differ from previously published figures.
For details,please refer to the calculation standards in the Environmental performance data report.
Greenhouse gas emissions (Scopes 1 and 2) calculated using the market-based standard: Breakdown by type of site
The site classification is calculated for the organizational scope of each site classification indicated in the "Scope of Data."
For details,please refer to the calculation standards in the Environmental performance data report.
Greenhouse gas emissions (Scope 3)
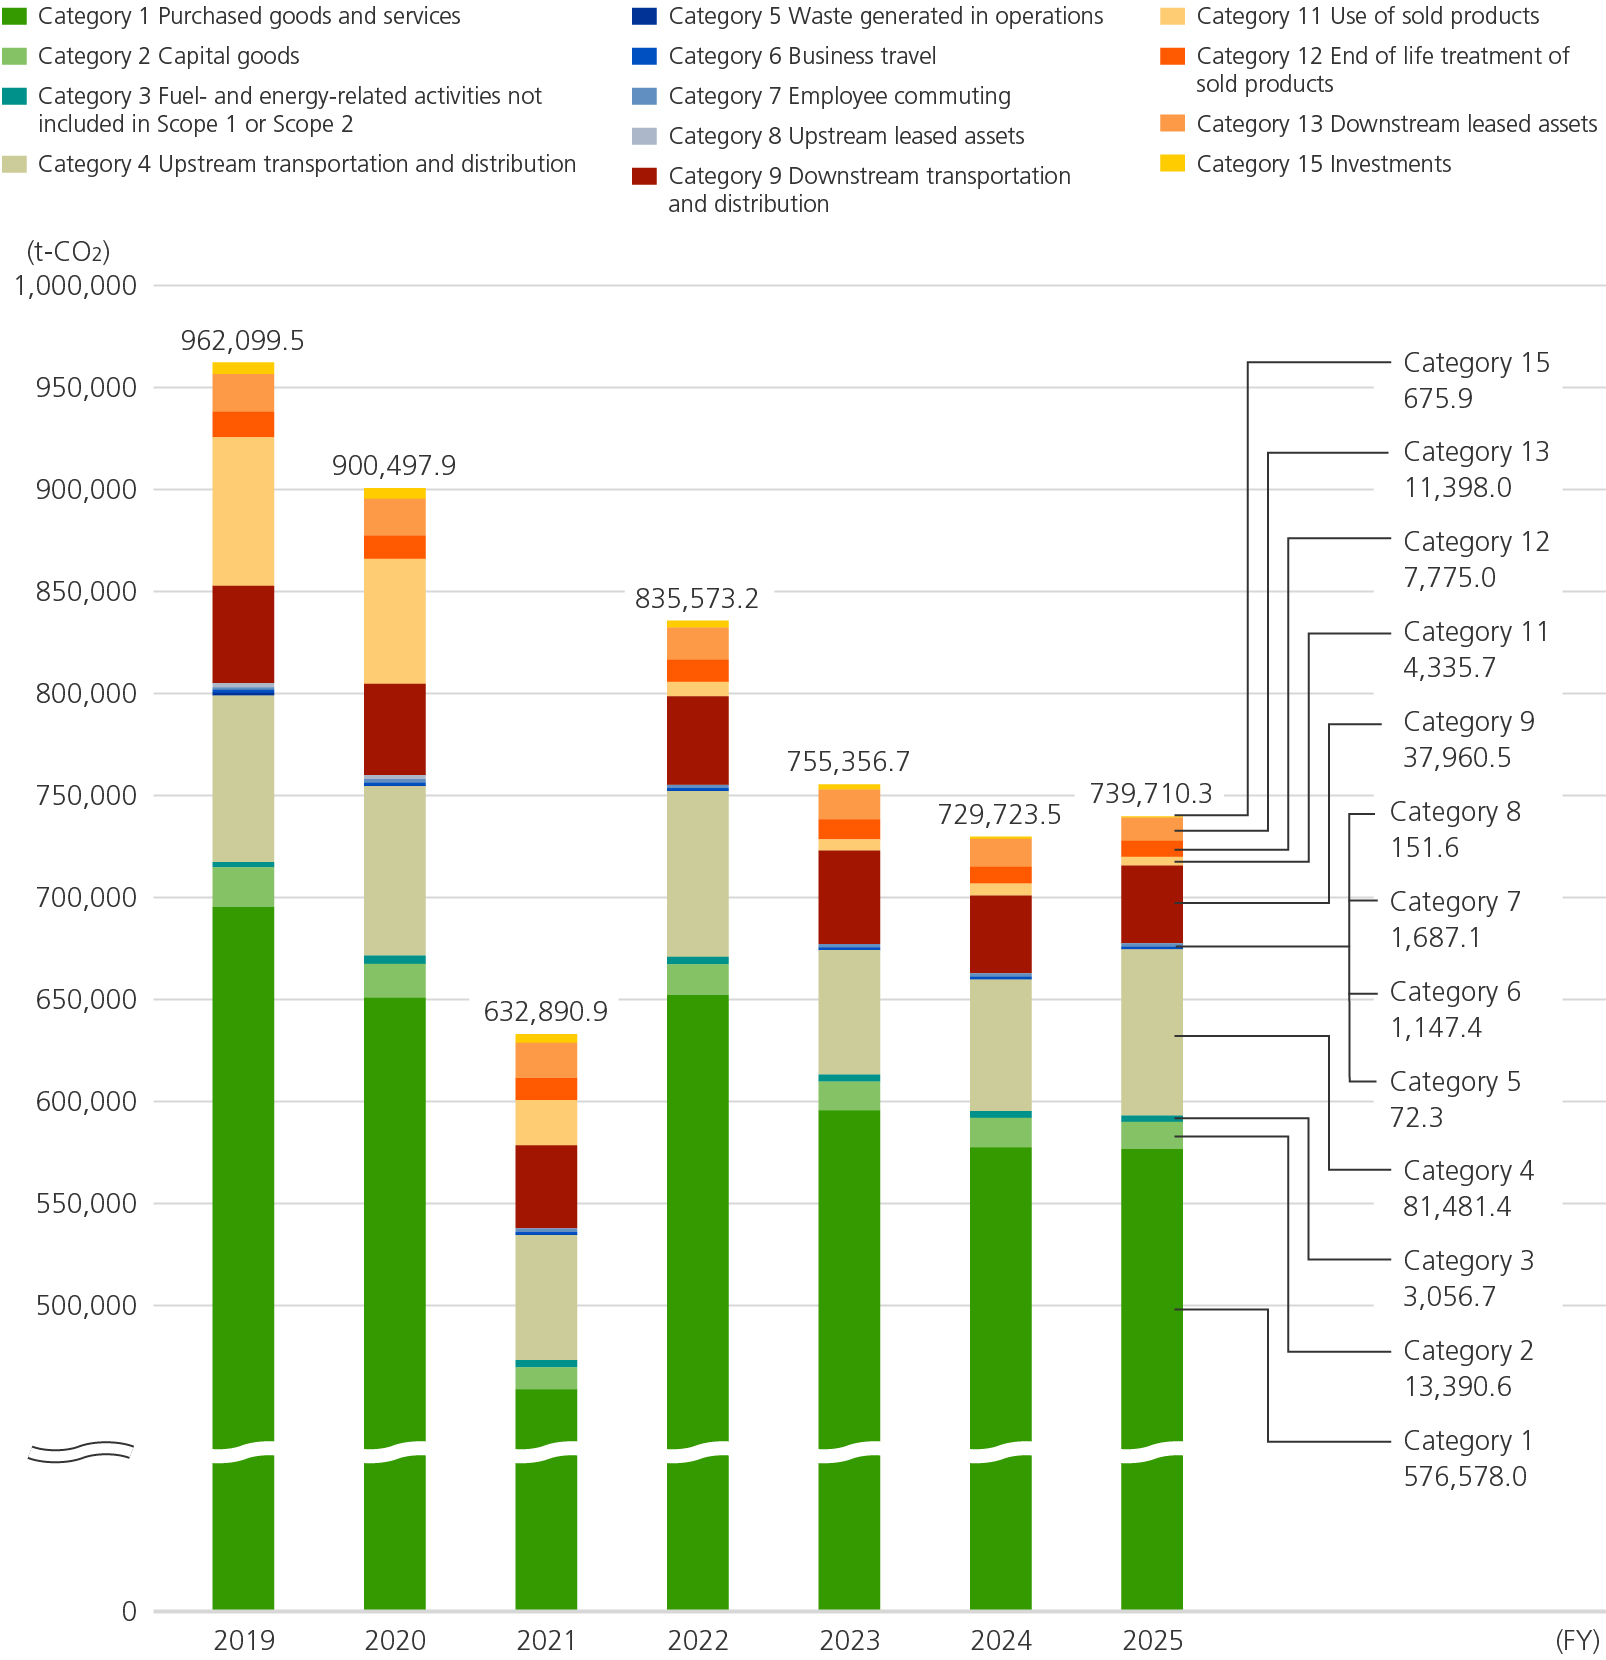
*Category 1 (344,491.8 t-CO2) ,Category 4 (56,350.6 t-CO2)and Categoy 11 (5,595.5 t-CO2) for FY2024 are assured by a third party.
Energy usage
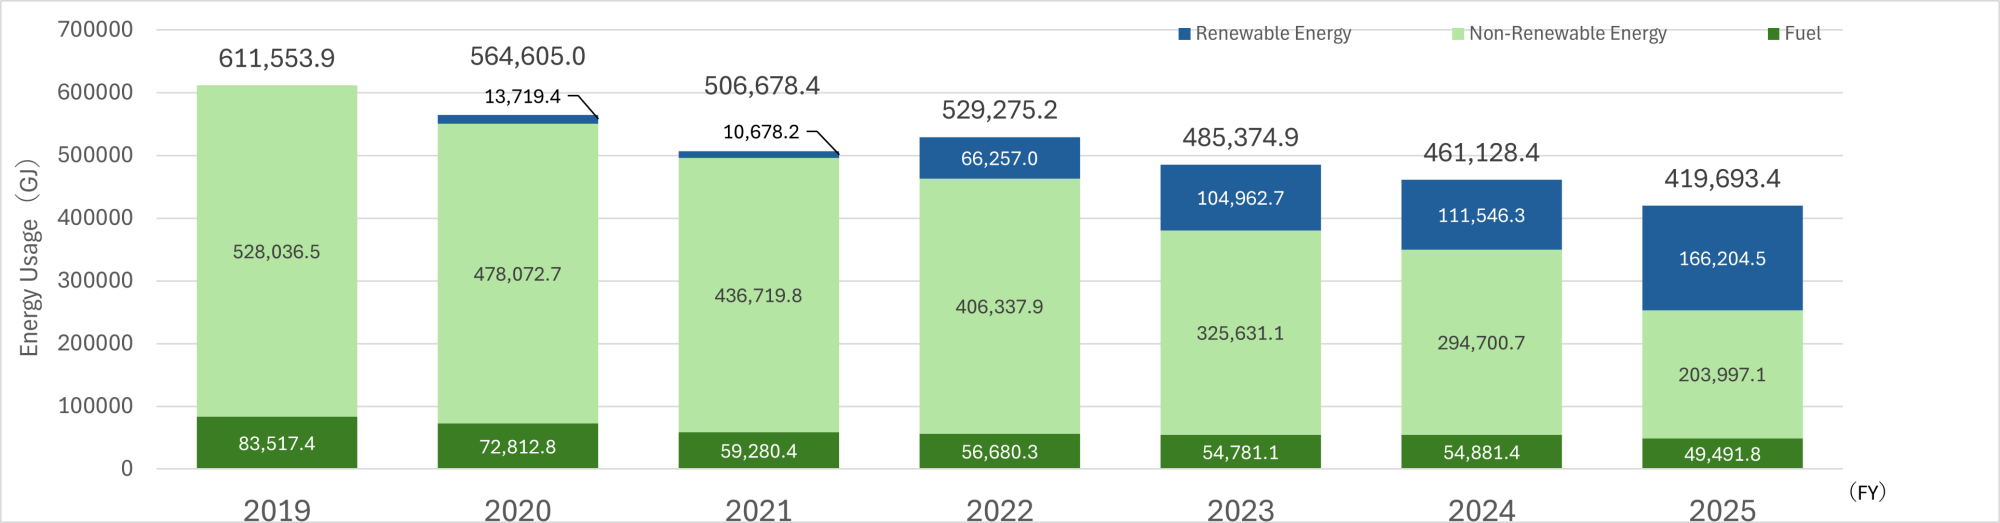
“Renewable” includes the following:
・Use of electricity generated in-house by solar panels
・Use of electricity supplied through a PPA model
・Use of electricity supplied from the power grid through a renewable energy plan contract with an electricity provider
For details,please refer to the calculation standards in the Environmental performance data report.
Waste related data
Generation of waste, etc.
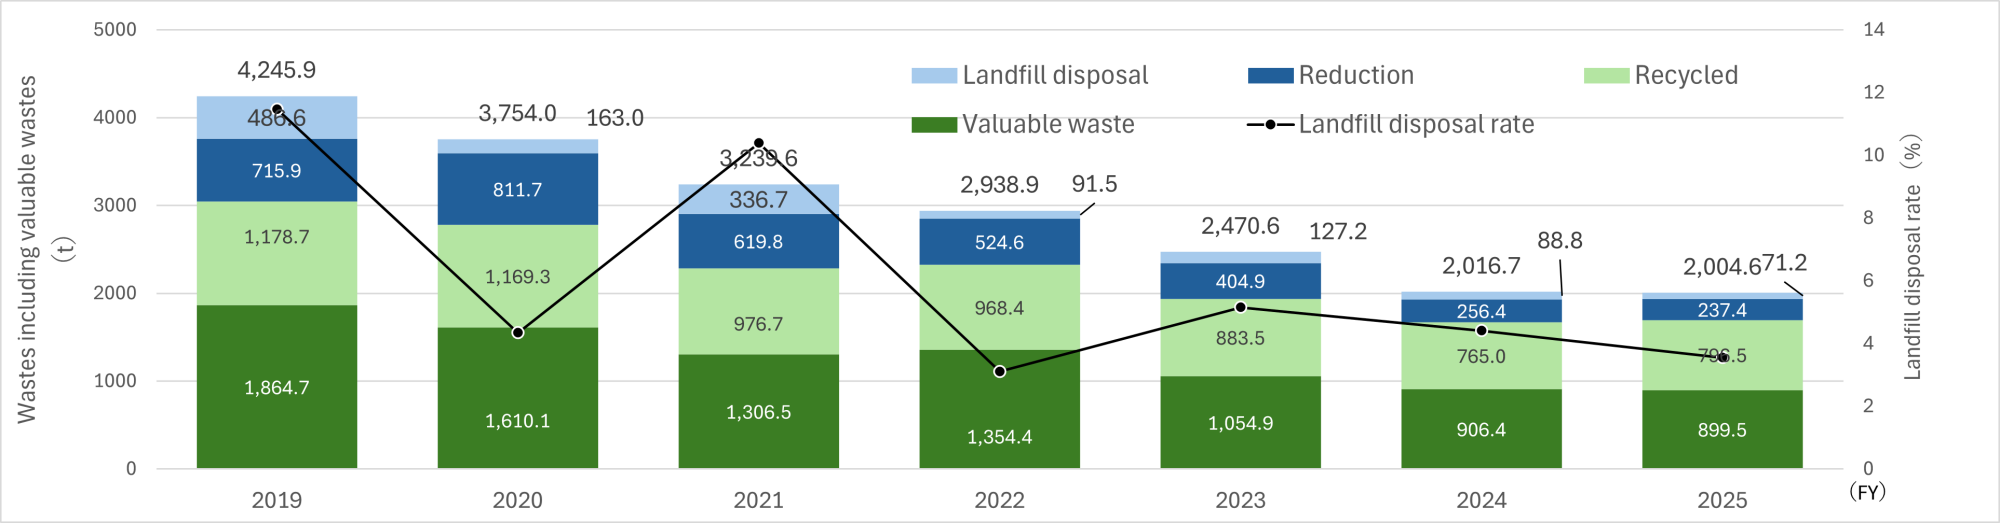
The amount of valuable materials generated for FY2025 (899.5 t) and the total waste generated (sum of recycled amounts, reductions, and final landfill disposals = 1,1105.1 t) have been subject to third-party assurance.
Emissions of waste: Breakdown by type of site
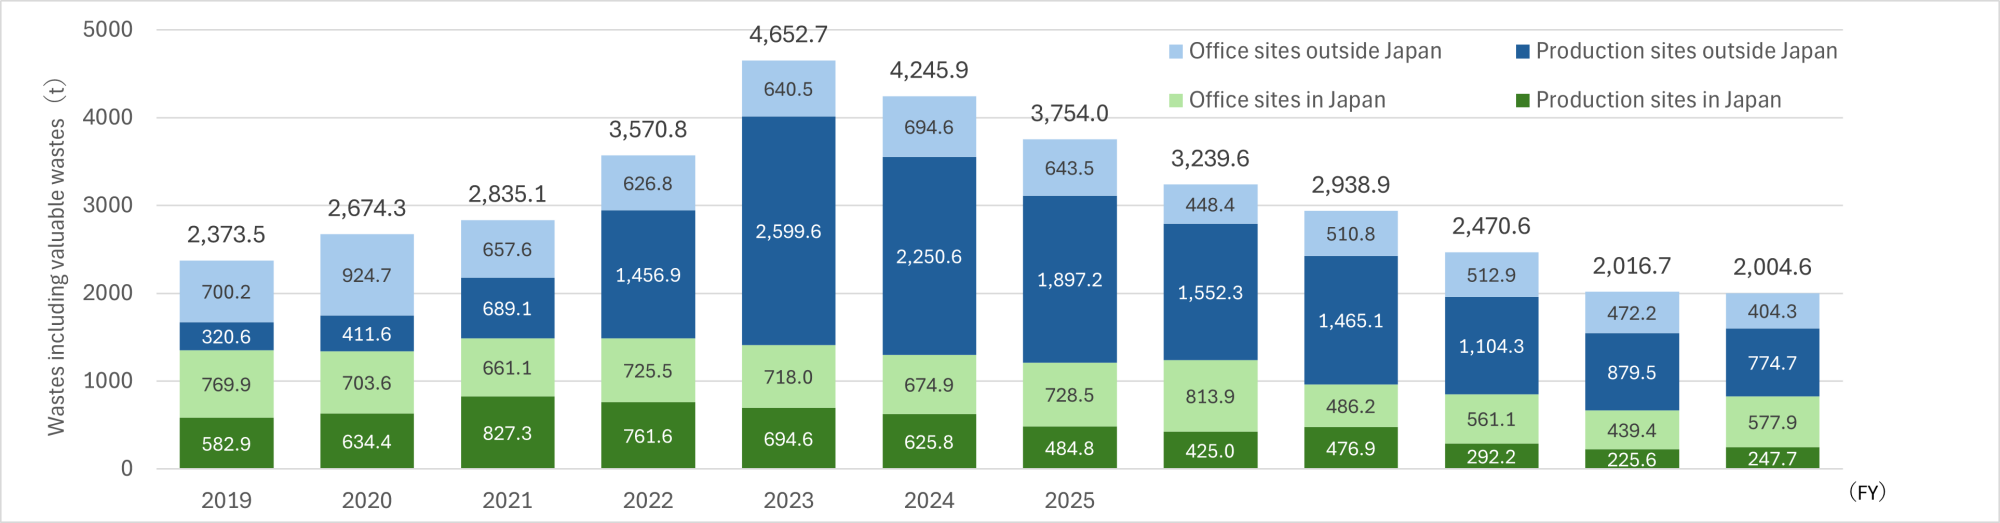
The site classification is calculated for the organizational scope of each site classification indicated in the "Scope of Data."
Generation of waste plastics (including valuable waste) at sites in Japan
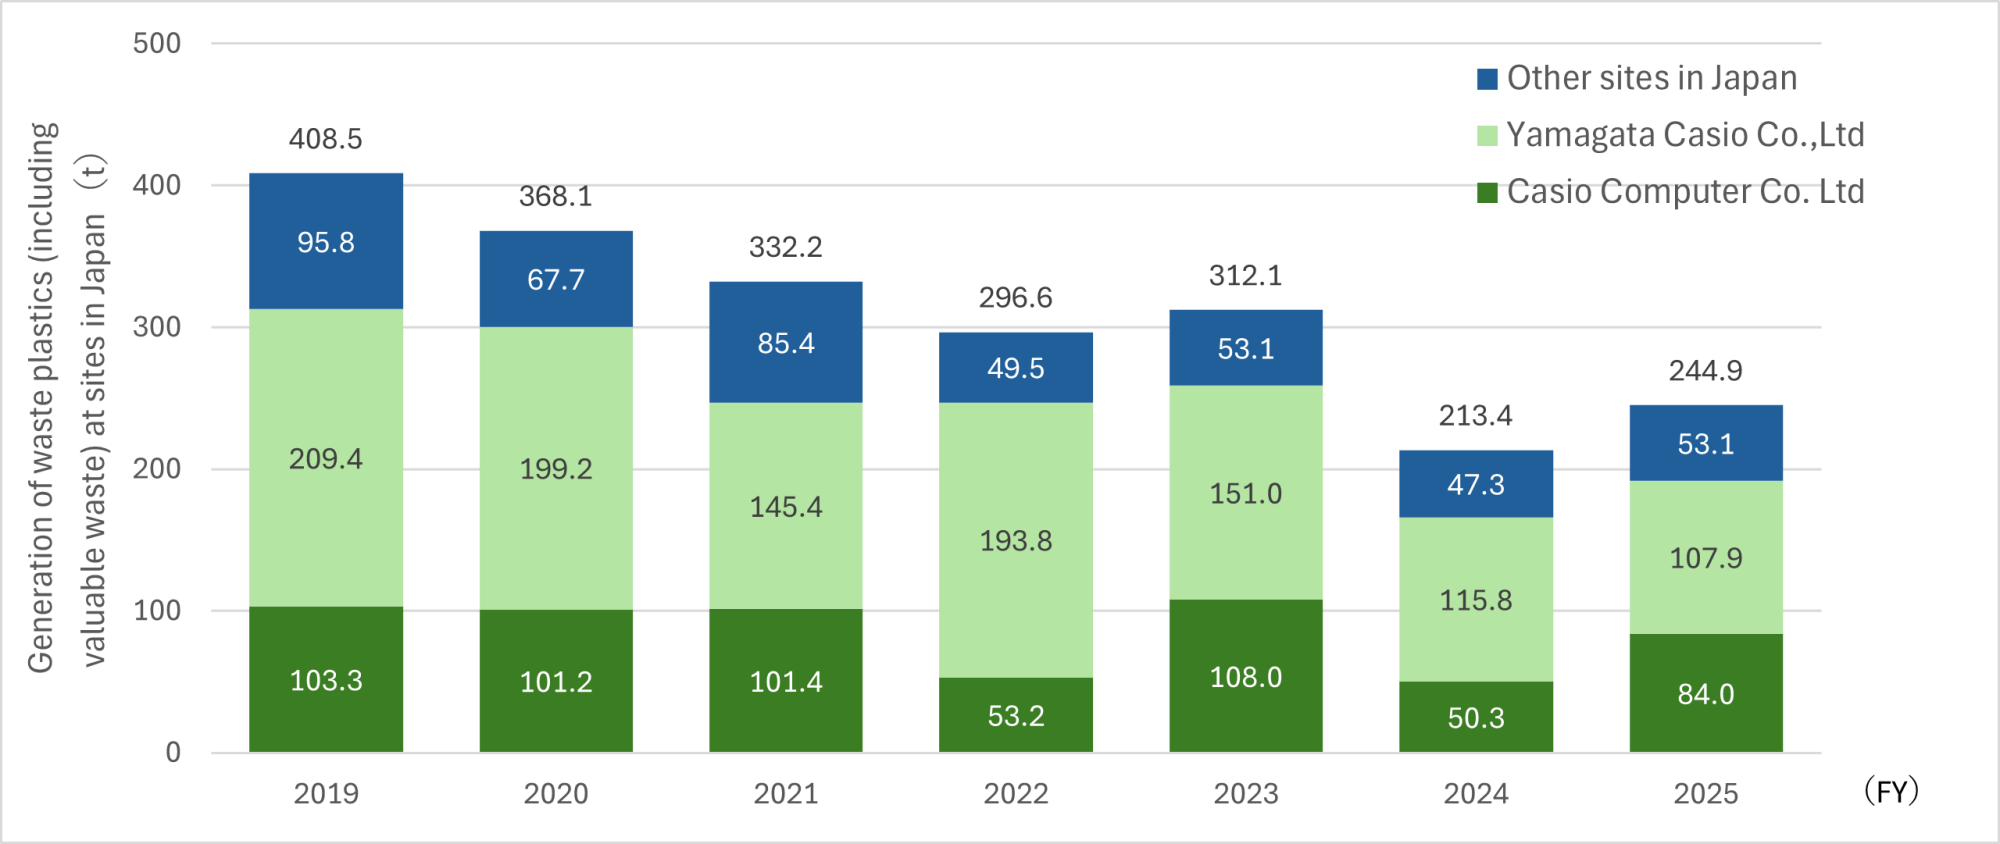
Figures for Casio Computer Co., Ltd. are calculated for the Casio Computer Co., Ltd. headquarters, the Hamura R&D Center, the Hachioji R&D Center, the Hatsudai Estate Building, and the company's sales offices in Japan. The figures for Yamagata Casio Co., Ltd. are calculated for the Yamagata Casio Co., Ltd. headquarters and Yamanashi Office.
Water resources
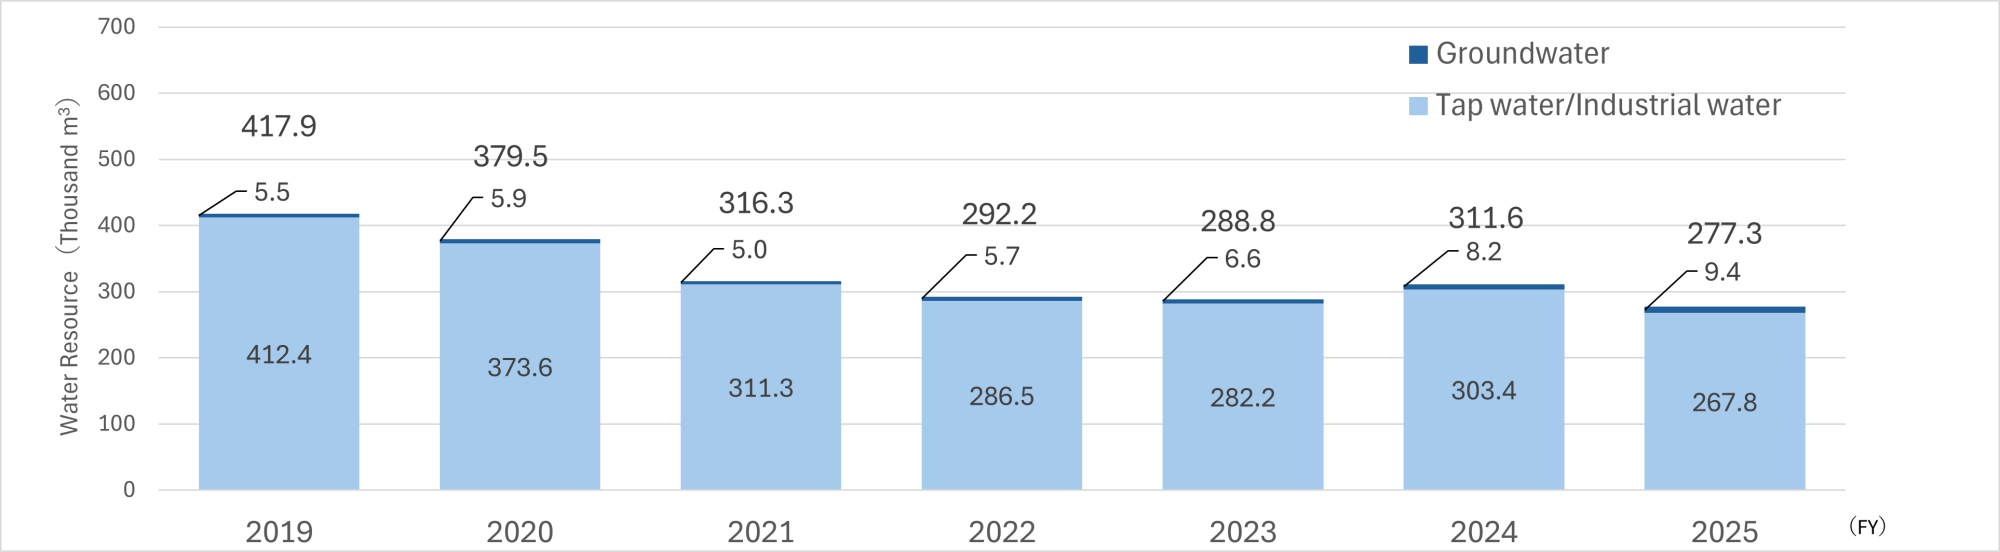
Total amount of water intake (277.3 x1000m3) for FY2025 are assured by a third party.
(Breakdown by type of site)
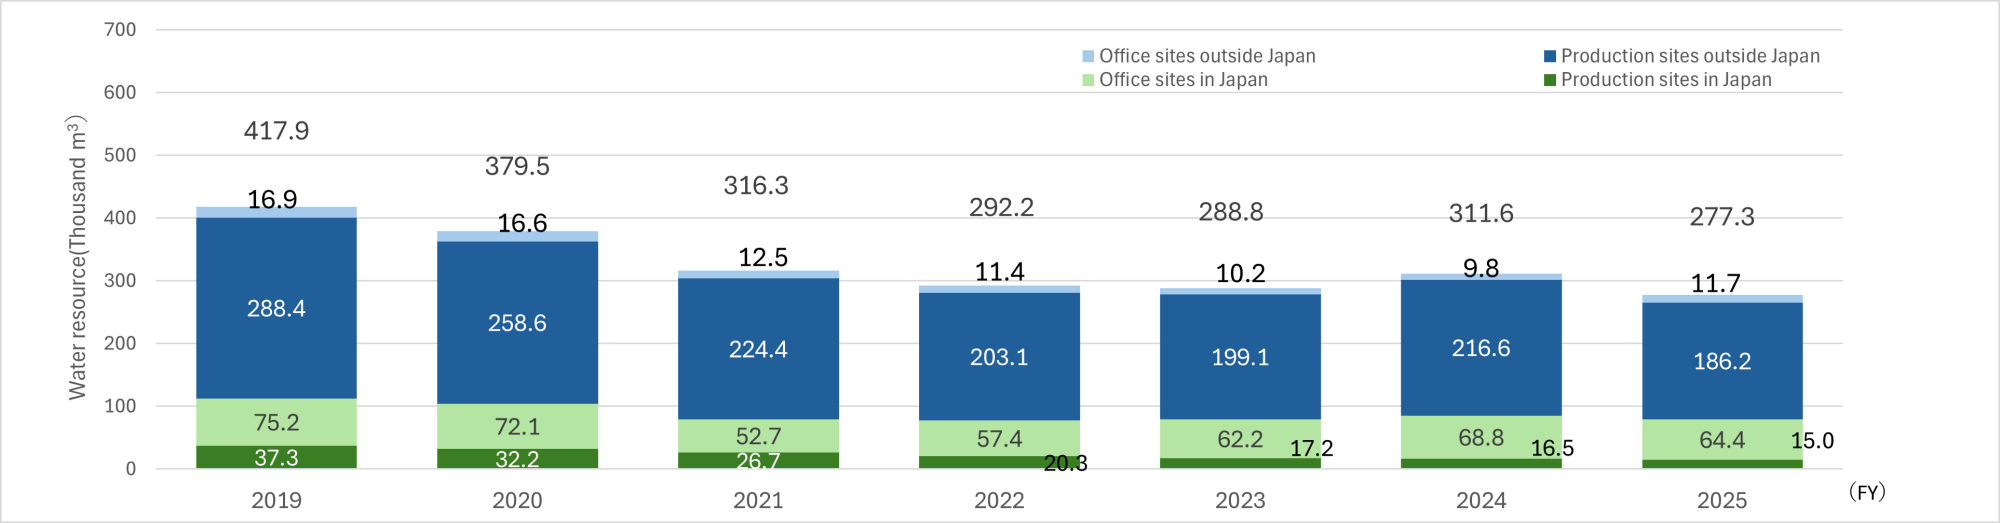
Total amount of water intake (277.3 x1000m3) for FY2025 are assured by a third party.
See Environmental performance data report for details.
*Updated on January 7, 2026