October 6, 2025
Corporate
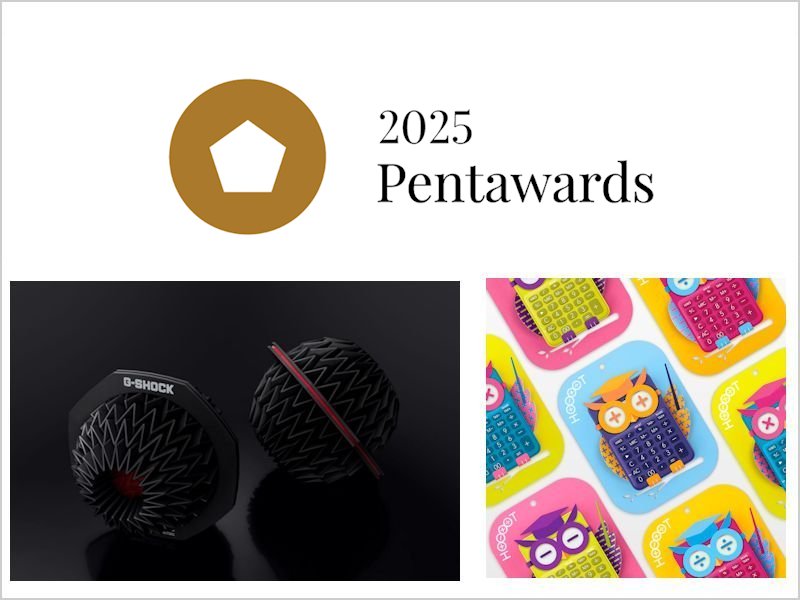
Casio Wins Pentawards 2025 for Watch and Calculator Packaging
Corporate Related
Product Related
Our Commitment to Sustainability as a Member of the International Community
Pursue Sustainable Growth for Both Company and Society
The Casio corporate creed, “Creativity and Contribution,” reflects our founders’ aspiration to give back to society by offering truly innovative products that never existed before.

Sustainability Implementation System
In fiscal 2021, Casio amended its existing CSR implementation system and established the Sustainability Committee. The Committee discusses important sustainability issues, including climate change, working closely with the Management Meeting.
Quality Assurance
Activities to Improve Customer Satisfaction
Intellectual Property Initiatives
Implementing CSR Procurement
Supply Chain Management
Providing Supportive Workplace Environments and Promoting Diversity
Making the Most of Human Resources and Maintaining Optimal Workplace Environments
Human Resource Development
Occupational Safety and Health
Respect for Human Rights
Considering Human Rights in Corporate Activities
Contributing to Society with Our Businesses
Social Contribution Activities
* Annual Update on January, 2026